So, you’re making business decisions based on data. That’s cool. I want to share another angle with you.
I co-host a podcast. Marketing Homebrew. It’s exciting to work on a new platform and, naturally, you become interested in the stats. You feel the need for reassurance that people are tuning in.
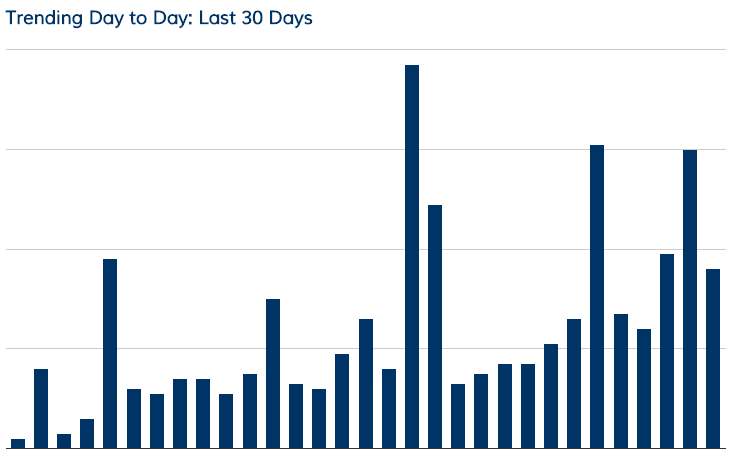
Take the following, as an example.

Good strong growth in terms of unique downloads of the latest shows. Really encouraging insight. Big spikes where the new shows go live – that tells me we’re building our audience.
But data doesn’t tell you about people. It doesn’t tell you why people consume content. It just tells you that people are consuming. In fact, it tells you very little.
Then, reality hits.
@heyidgroup @HomebrewPodcast @iRhodes Look who talked me home tonight. Quality increasing by the episode. Well done. pic.twitter.com/sq9dHXvvfC
— Wayne Mitchell (@WayneJMitchell) March 24, 2015
Real people doing real things that we can now relate to. Data in context. We’re part of the commute. How fun is that? The recordings we make each week are now flowing through the speakers as people travel back and forth to work.
Now, you look at the data points and get a better understanding of what that data actually represents. This isn’t about people downloading, it’s about people listening in. People consuming.
When you guide your decisions by data, you’re looking for trends. Reasons to do things. Reasons to stop.
This may sound obvious to you. But, for many, it isn’t. That graph you share with your colleagues. Each data point is human consumption of content. People reading, listening or watching.
Somehow we have to make that data real. That’s the opportunity social media presents to your business. Forget about the impressions and shares just for a moment. Where’s the conversation? How are you finding out how people react to the content you create?
We’re engulfed by data. We make decisions based upon data. If I witnessed 30 days of downward trend, would I question the time I spend creating the podcast each week? I probably would. I probably would if I removed myself from the human element of content creation.
When you create content you’re taking on a responsibility. Your responsibility is to justify the time people spend reading or listening to what you’re putting out there. Your responsibility is to make that time worthwhile.
To gain that responsibility you need to clear your desk of graphs and trend lines and look at what’s really taking place. Real people with real lives doing real things in real time.
Here’s my point. Create content you’re ready to take responsibility for. Don’t just shovel out content to prop up the graphs. Look behind the graph. Look at how people react to your content, the comments, the conversations that you instigate.
I’m encouraged by the fact we’re seeing a good response to the podcast. Knowing that just one person took the time to listen to the podcast on his commute, that changes my entire outlook. It makes things real. It helps you raise your game. It drives you to produce better, more insightful, content knowing that there’s somebody on the other side of that graph.
