I’m wearing the CRO-hat a lot with my work. I know you are too.
There’s something about the measurement of conversion rate that bothers me. Tremendously. The whole generic nature of a single %.
It makes the question ‘how do we increase our conversion rate?’ redundant.
People shop at a micro level. They buy products. Small amounts of products.
Ecommerce stores measure conversion at macro level. Like people buy all products. That’s wrong.
How to build a better understanding of conversion rate at product level
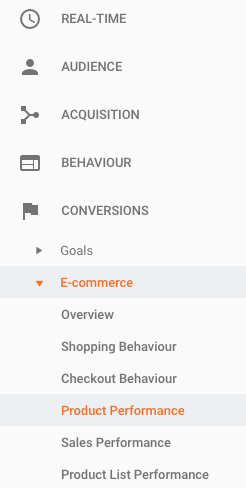
 I talk a lot about new tech. There’s one piece of marketing tech that has been around for years. Your old friend Google Analytics. Now assuming you’ve made the upgrade to Enhanced Ecommerce reporting, I want to introduce you to a great friend of mine. The Product Performance report. It’s nested in the Conversions > E-commerce tab (click Shopping Behavior) of your GA interface.
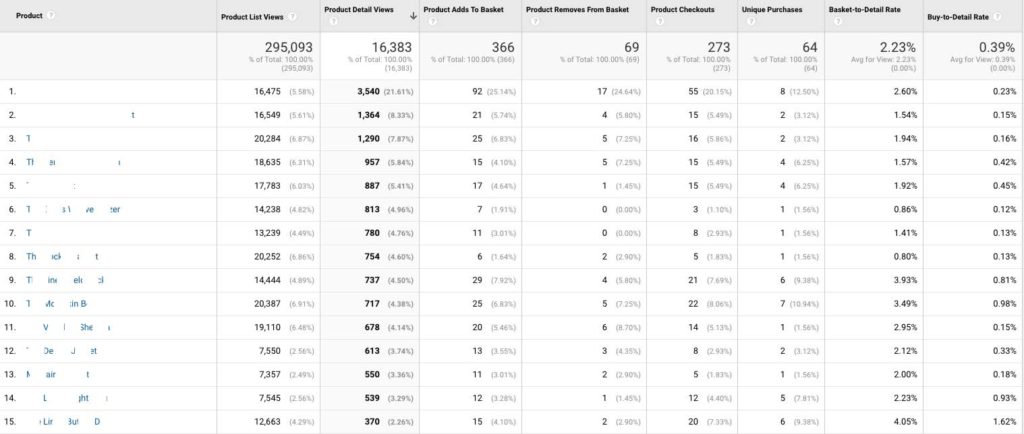
What this powerful, yet rarely used, report provides you is gold dust. Conversion rate data at a product-based level.
It gives you an understanding of:
- Product list views: which products are most viewed within a product category page
- Product detail views: how often that product’s unique page is viewed
- Product adds to basket: how often that product is added to basket
- Product removes from basket: how often people take the product out of their basket
- Product checkouts: how often that product is included in the checkout process
- Unique purchases: how often that product is purchased following a product-page view
- Basket-to-detail rate: the percentage of times people add a specific product to their basket from the product page
- Buy-to-detail rate: the percentage of times that product is purchased divided by the volume of product page views
8 absolutely critical data points relevant to so many facets of your ecommerce business.

Buying teams get to understand the popularity of products. Designers/CRO specialists/ Copywriters get to know the products that are performing well and those that aren’t. Using this information you have a whole better understanding of the value of conversion. Not some number between 1% and 2% that prompts the question ‘how can we increase this conversion thing?‘
If you filter your data by, lets say 100+ product detail views, and then click the ‘Basket-to-Detail rate’ you’ll have a clear picture of a key factor in conversion – which products are being added to the basket. You’ll uncover some surprises. High volume views with low percentage add to basket rates. These are the products you need to focus your CRO efforts upon.
- is the product imagery relevant?
- is the price competitive?
- is the copy compelling and up to date?
- can I access shipping times and prices from this page?
For fashion brands, specifically:
- are sizing and colour variants clear?
- are you providing close-up product shots?
- is it clear which size is modelled?
- is it clear which fabrics are used?
Using the Product Performance data you’re going granular. You’re looking at data that is highly relevant and the data that, when used correctly, tweaks the conversion rate dials product-by-product.
This is where you focus your efforts. Not the homepage, not the about us section, but the product pages. The pages where people decide whether to buy what you sell, or not.

